This article provides an overview of the insights available through the Dashboard for a Collective™.
The Dashboard is only available to Admins of a Collective. It includes three sections:
- Reach
- Adoption & Engagement
- Trends & Market Benchmarks
Let's take a look at what you'll see in each section.
Reach
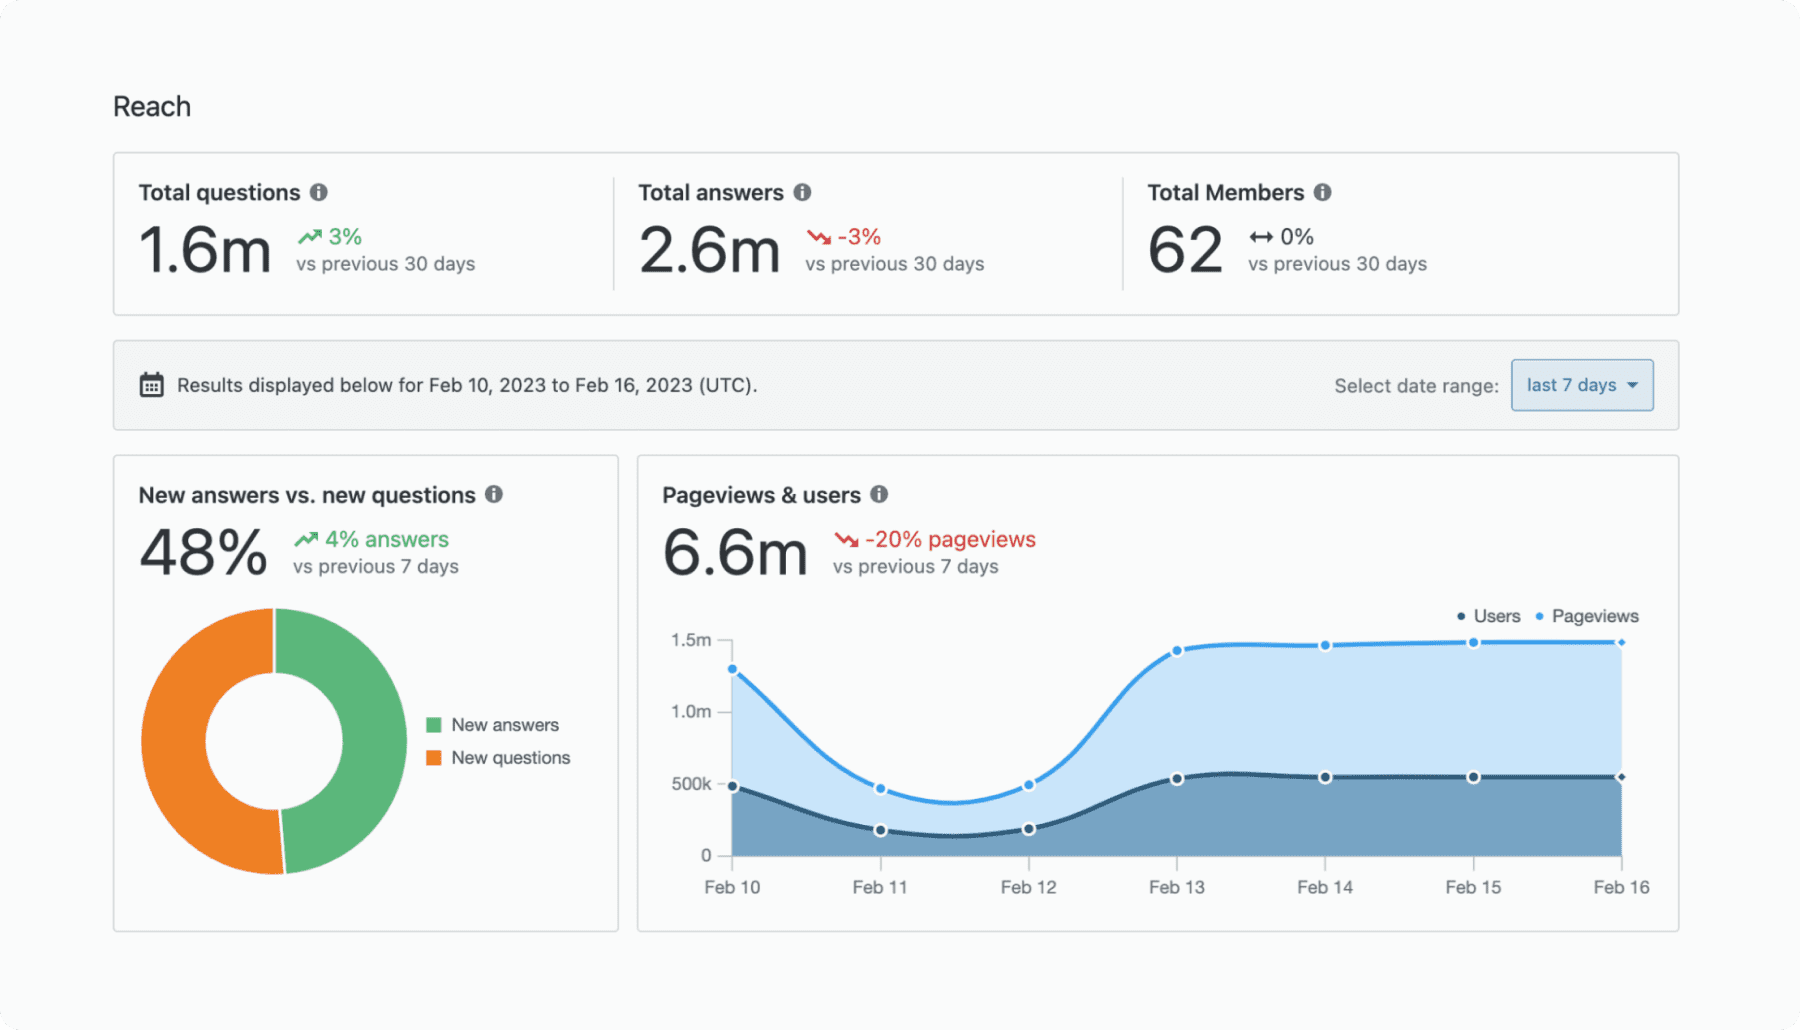
In this section of the Dashboard, you'll find insights into the overall size of a Collective, including the total number of questions, answers, and members (refreshed daily) and users and pageviews (based on the selected date range).

These insights are refreshed daily.
- Total Questions: The total number of questions using tags associated with the Collective.
- Total Answers: The total number of answers using tags associated with the Collective.
- Total Members: The total number of users who have joined the Collective.
The remaining insights on the Dashboard will be based on the date range you select on the right side of the page along the gray bar. Just click on the ‘Select date range:’ drop down and you can choose a start date that’s a maximum of two years or a minimum of one day prior to today’s date.
- New Answers vs. New Questions: Compare the number of new answers versus new questions contributed within the selected timeframe.
- Page views & Users:
Page views are defined as the total number of times pages using a Collective's tags were viewed within the selected timeframe.
Users are defined as the total number of users (logged in or anonymous) who visited pages using a Collective's tags within the selected timeframe.
Adoption & Engagement
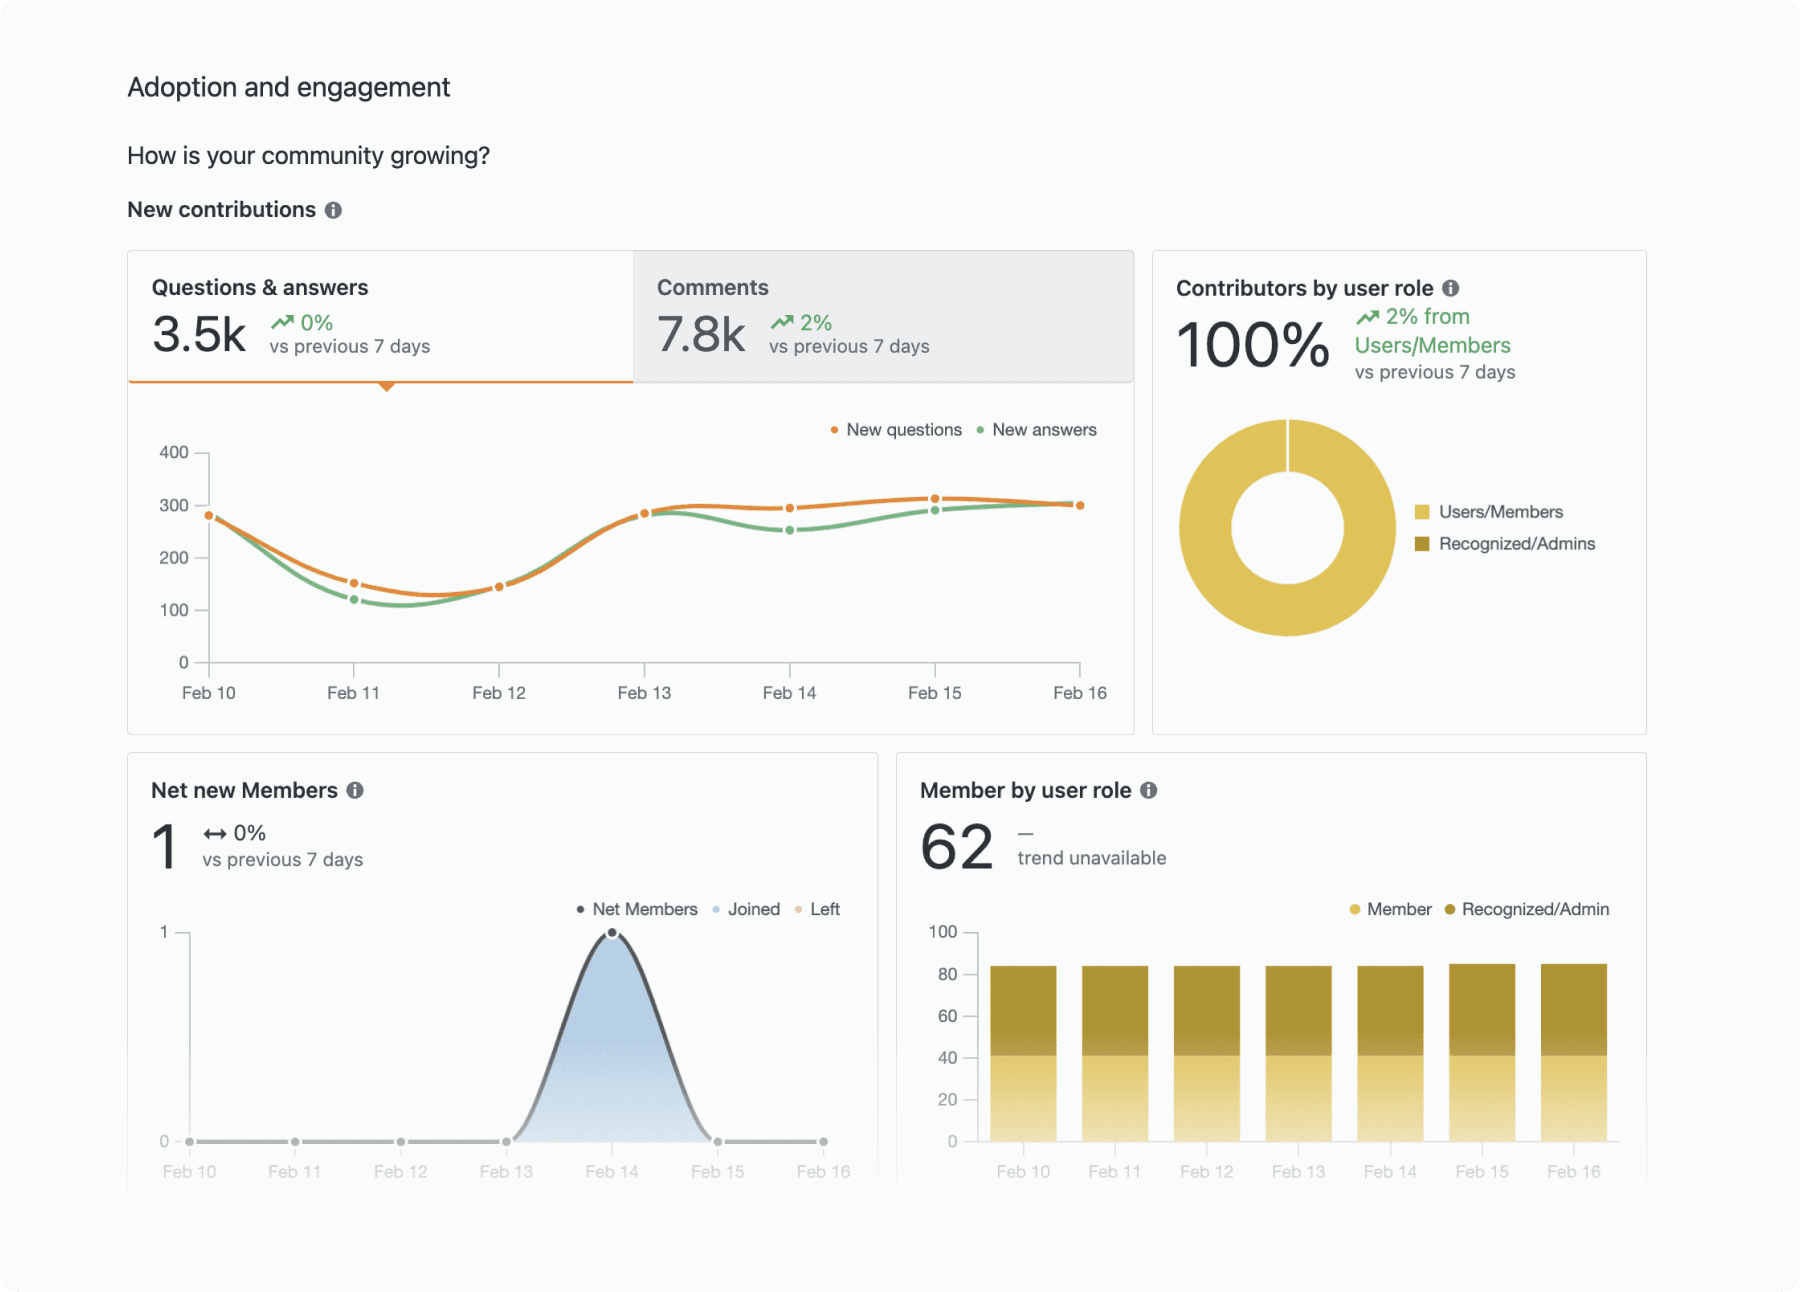
This section helps you understand the adoption of a Collective, including the number of members who joined or left within a selected timeframe and a breakout of members versus Admins and Recognized Members.
You can also see engagement metrics, such as number of new questions, answers, and comments in a Collective and the user roles that are contributing new content within a selected timeframe.

- Total Questions & Answers and Comments: Across the top, you'll find the total number of new questions and answers and comments that use certain Collective's tags within the selected timeframe.
- Content Contributors: Understand who is contributing content to a Collective. See how contributions from Admins and Recognized Members compare to Members/users within the selected timeframe.
- Net new Members: View the members that have either joined or left the Collective within the selected timeframe.
- Members by user role: See the total number of Members by user role within the selected timeframe. Also, see a breakout of Members versus Recognized Members/Admins.
Trends & Market Benchmarks
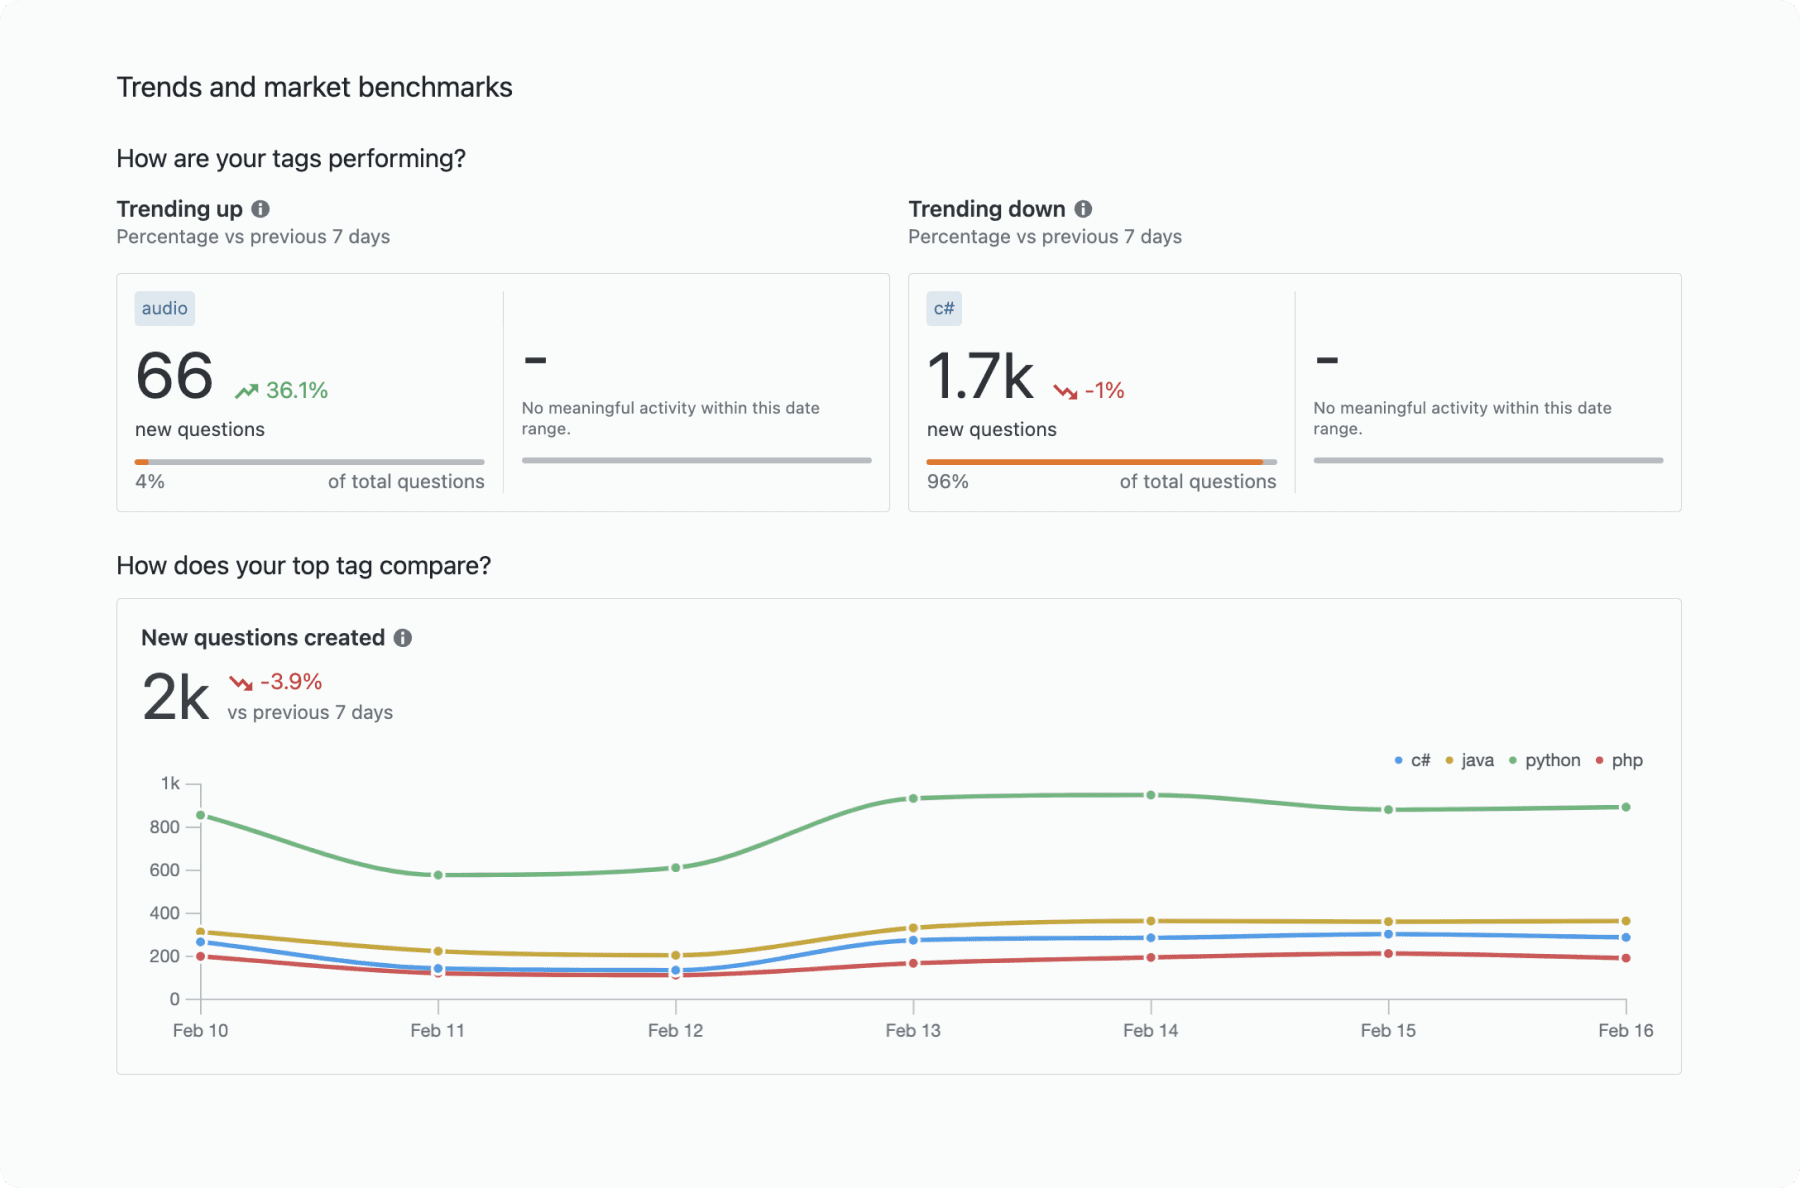
This section of the dashboard provides you with some additional context for the data. You'll find the tags in a Collective that are trending and also see how the number of new questions asked using a primary tag compares to the competitors' tag activity.

- Tags trending up in usage: See the two tags increasing in use on new questions asked in a Collective within the selected timeframe. You'll also find the percent increase in the number of questions using the tag compared to the previous period, as well as the percent of total questions in a Collective using that tag.
- Tags trending down in usage: See the two tags decreasing in use on new questions asked in a Collective within the selected timeframe. You'll also find the percent decrease in the number of questions using the tag compared to the previous period, as well as the percent of total questions in a Collective using that tag.
- Competitive tag insights: Compare the top tag in a Collective to three competitors’ tags within a selected timeframe. This data is based on the number of new questions created on Stack Overflow using the tag.
Note: The Competitive tag insights chart limited to three competitive tags. Refer to https://stackoverflow.com/tags to view all active tags on Stack Overflow.