Knowledge silos can feel like an obscure concept, but we know they exist when we feel the frustration of not being able to access the answer or domain expert we need to move a project forward. In fact, 70% of the 42,000 respondents in our 2023 Developer Survey said they encounter at least one silo per week. If employees freely share knowledge with one another instead of gatekeeping, everyone can effectively self-serve and be more productive.
So, if knowledge silos create blockers and stall projects, how do you pinpoint them and develop strategies to reduce them? That’s where Connectivity can help! Connectivity is a new Stack Overflow for Teams Enterprise Dashboard feature that gives your organization visibility into how knowledge flows between different departments and job titles.
Read on to learn more about how your organization can use Connectivity, and if you’re not currently on our Enterprise plan, contact us to see Connectivity in action.
How Connectivity works
Connectivity surfaces the cross-functional collaboration that’s already happening in Stack Overflow for Teams Enterprise by showing connections between your organization’s departments and job titles. That way, you can see who is, or isn’t, sharing knowledge to prevent knowledge silos and foster even more collaboration.
Enterprise customers can access their organization’s Connectivity insights by clicking the Dashboard in the left-hand menu and then Connectivity at the top of the page. Note: Connectivity requires your site to store Department and Job title information for each user. If you don't see any Connectivity data, please reach out to your site administrator.
Connection insights
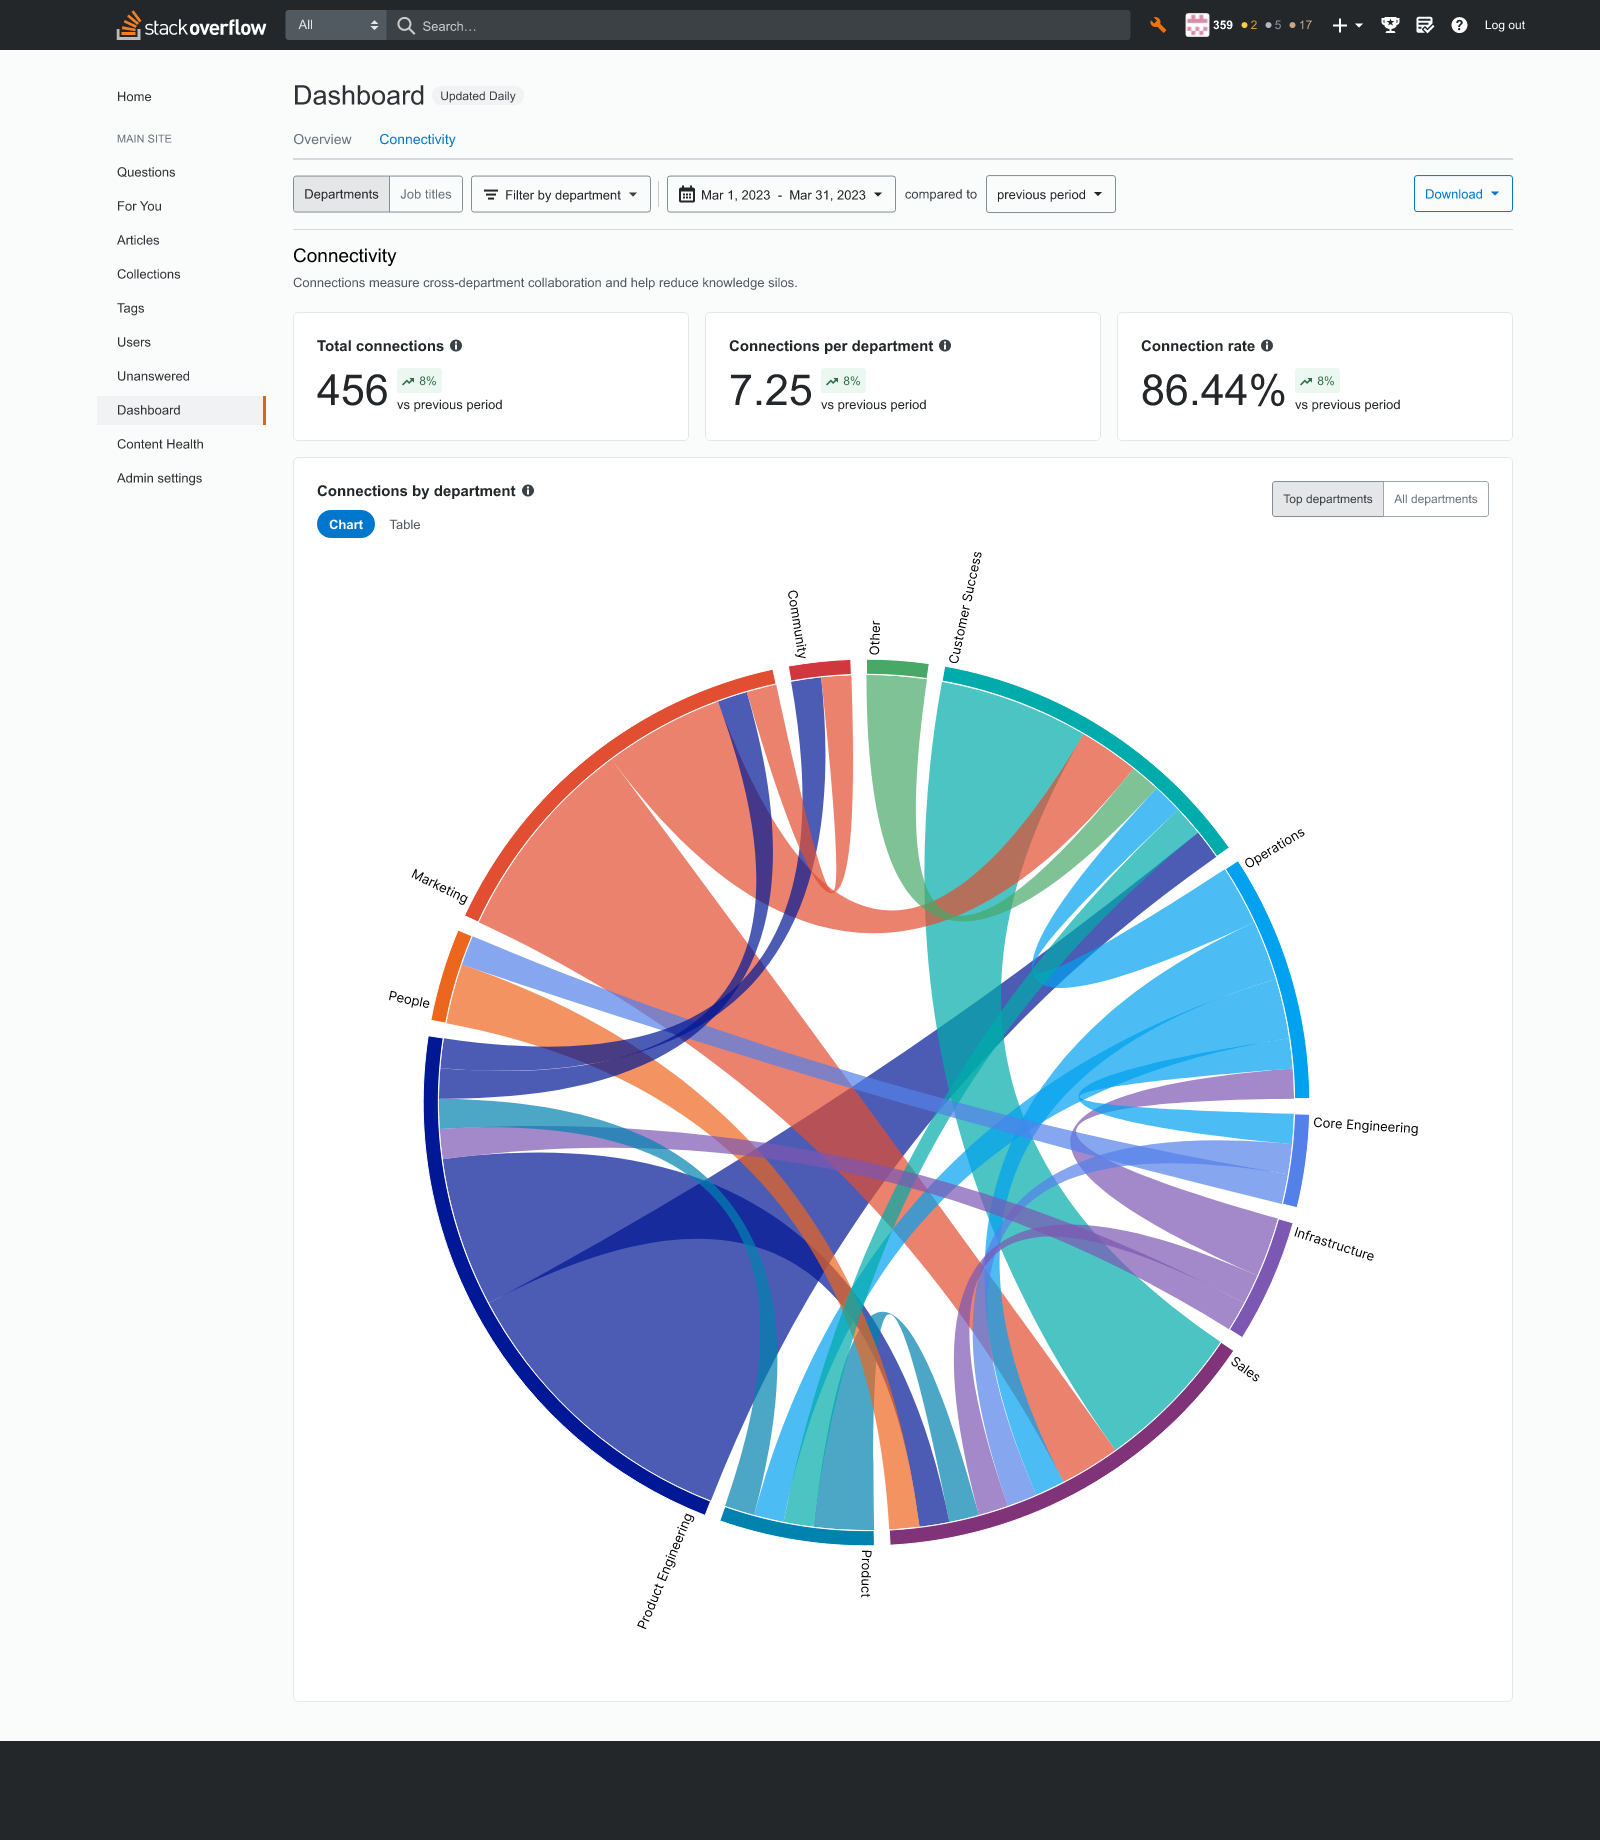
In the Connectivity dashboard, a “connection” is a user from one department or job title answering the question of a user from a different department or job title. Here are the connection insights available to you:
- Total connections - The total number of answers that were submitted by a user in a different department or job title.
- Connections per department / job title - The average number of connections per department or job title.
- Connection rate - The percentage of questions that were answered by a user in a different department or job title.
You can get an at-a-glance view of connections by department or job title in a chord diagram:
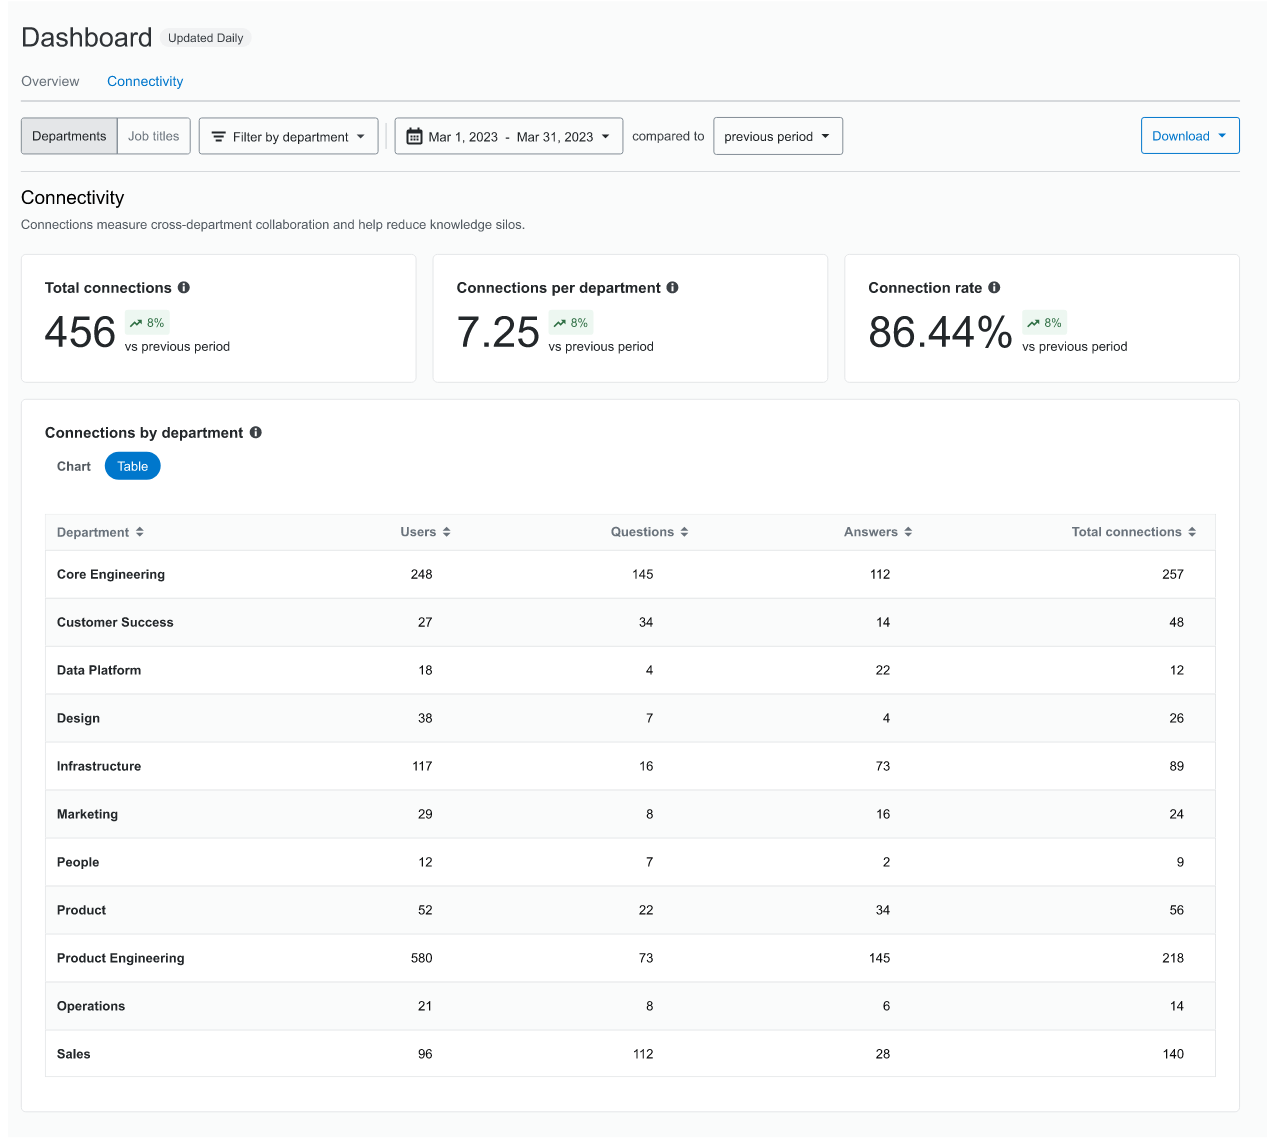
You can also get a more detailed view of connections in a table:
Filters and controls
At the top of the Connectivity page you’ll see a series of filters and controls. You can view Connectivity by Departments or Job Titles and have the option to filter by a particular Department or Job Title if you have one in mind. If you would like to see Connectivity for a specific time period, select the date range and compare it to a previous time period to determine if your organization’s connections have increased or decreased.
To learn more about how Connectivity works, view the help documentation.
How your organization can make the most of Connectivity
How can your organization start using Connectivity today to increase collaboration and maximize the value of Stack Overflow for Teams? Review our tips below to get started.
Get visibility into cross-functional collaboration
Before Connectivity, you may have never had visibility into how often cross-functional collaboration is happening at your organization. You’ll now be able to see how teams engage with one another and how often answers come from other departments and job titles. These insights will allow you to recognize where collaboration is happening and where there are gaps.
If you’re a site admin or Community Manager, you’ll want to review your Connectivity page on a regular basis. You can also share these insights with other stakeholders and executive sponsors to showcase how Stack Overflow for Teams is enabling more efficient knowledge sharing and collaboration at your organization.
View, measure, and grow connections
If you do see collaboration gaps, you can start measuring and growing your site’s connections. You’ll first want to establish a baseline for how often knowledge is shared between departments and job titles at your organization. You can then develop strategies for increasing connections in a specified time period and measure improvement over time. Connectivity makes it easy to pinpoint departments or job titles that aren’t sharing knowledge so that you can tailor your strategies accordingly.
As an end-user, you can use Connectivity to see how your coworkers are connecting. See which departments and roles share knowledge the most to learn who the experts are at your organization and identify areas that possess knowledge relevant to the projects you’re working on.
Inform your knowledge-sharing strategy
If you’re a site Community Manager, you’re already monitoring Dashboard insights like interaction rate, median time to answer, and answer ratio to manage and grow your knowledge sharing community. Connectivity is now another tool in your toolkit that can help you achieve your knowledge sharing goals.
For example, if your site’s average median time to answer is below where you want it to be, could it be because the right departments aren’t engaged and using the platform? Connectivity can help you pinpoint these knowledge gaps and identify areas of improvement.