Stack Overflow for Teams improves collaboration, breaks down silos, and accelerates your organization’s initiatives, but gathering the data to tell this story to stakeholders can take time and effort. Read on to learn how the enhanced Weekly Dashboard Report makes it easier to prove community impact.
What's changed and why
The previous Weekly Dashboard Report was a summary of community insights positioned to site administrators and Community Managers. We have broadened the report's reach to an executive audience with higher level goals and priorities and have added the ability to send it to recipients that aren't Stack Overflow for Teams users. For example, the report now shows emerging topics and their designated subject matter experts (SMEs) so executive stakeholders have visibility into how Stack Overflow for Teams is impacting collaboration and business initiatives.
Breakdown of report insights
Report introduction
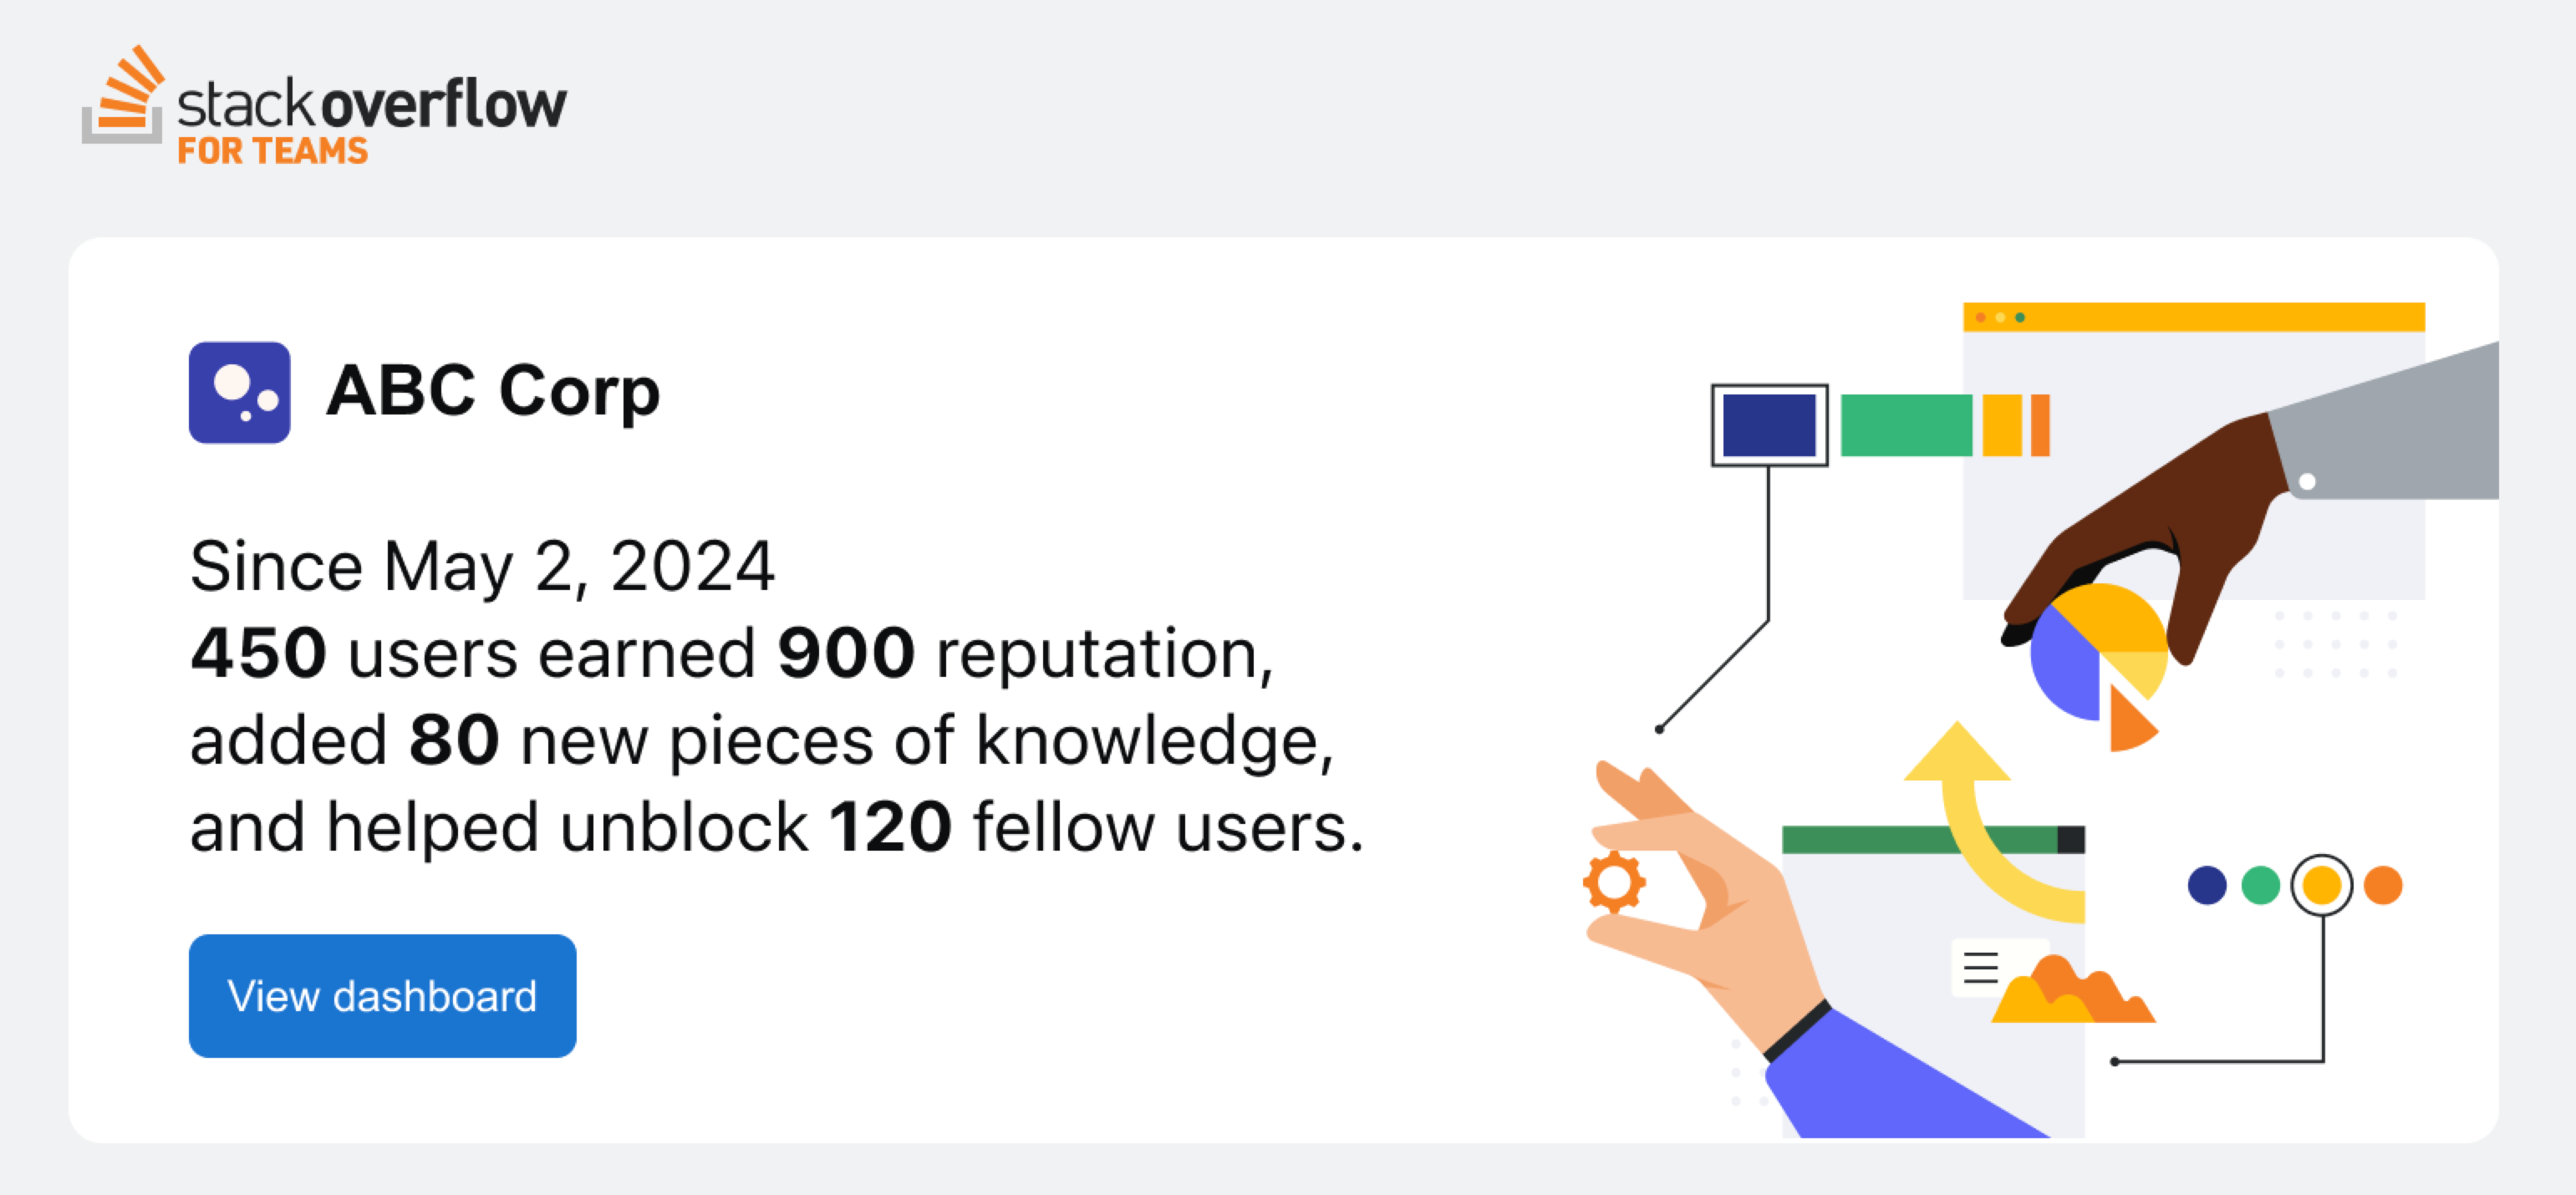
The report introduction provides a snapshot of how key community health metrics have changed since the last reporting period (the report is based on a 4-week rolling period). You'll see how much reputation users have earned, how many new pieces of knowledge have been added, and how many users were "unblocked" as a result. We calculate "unblocked users" based on the number of new answers and upvotes in the reporting period.
Emerging topics
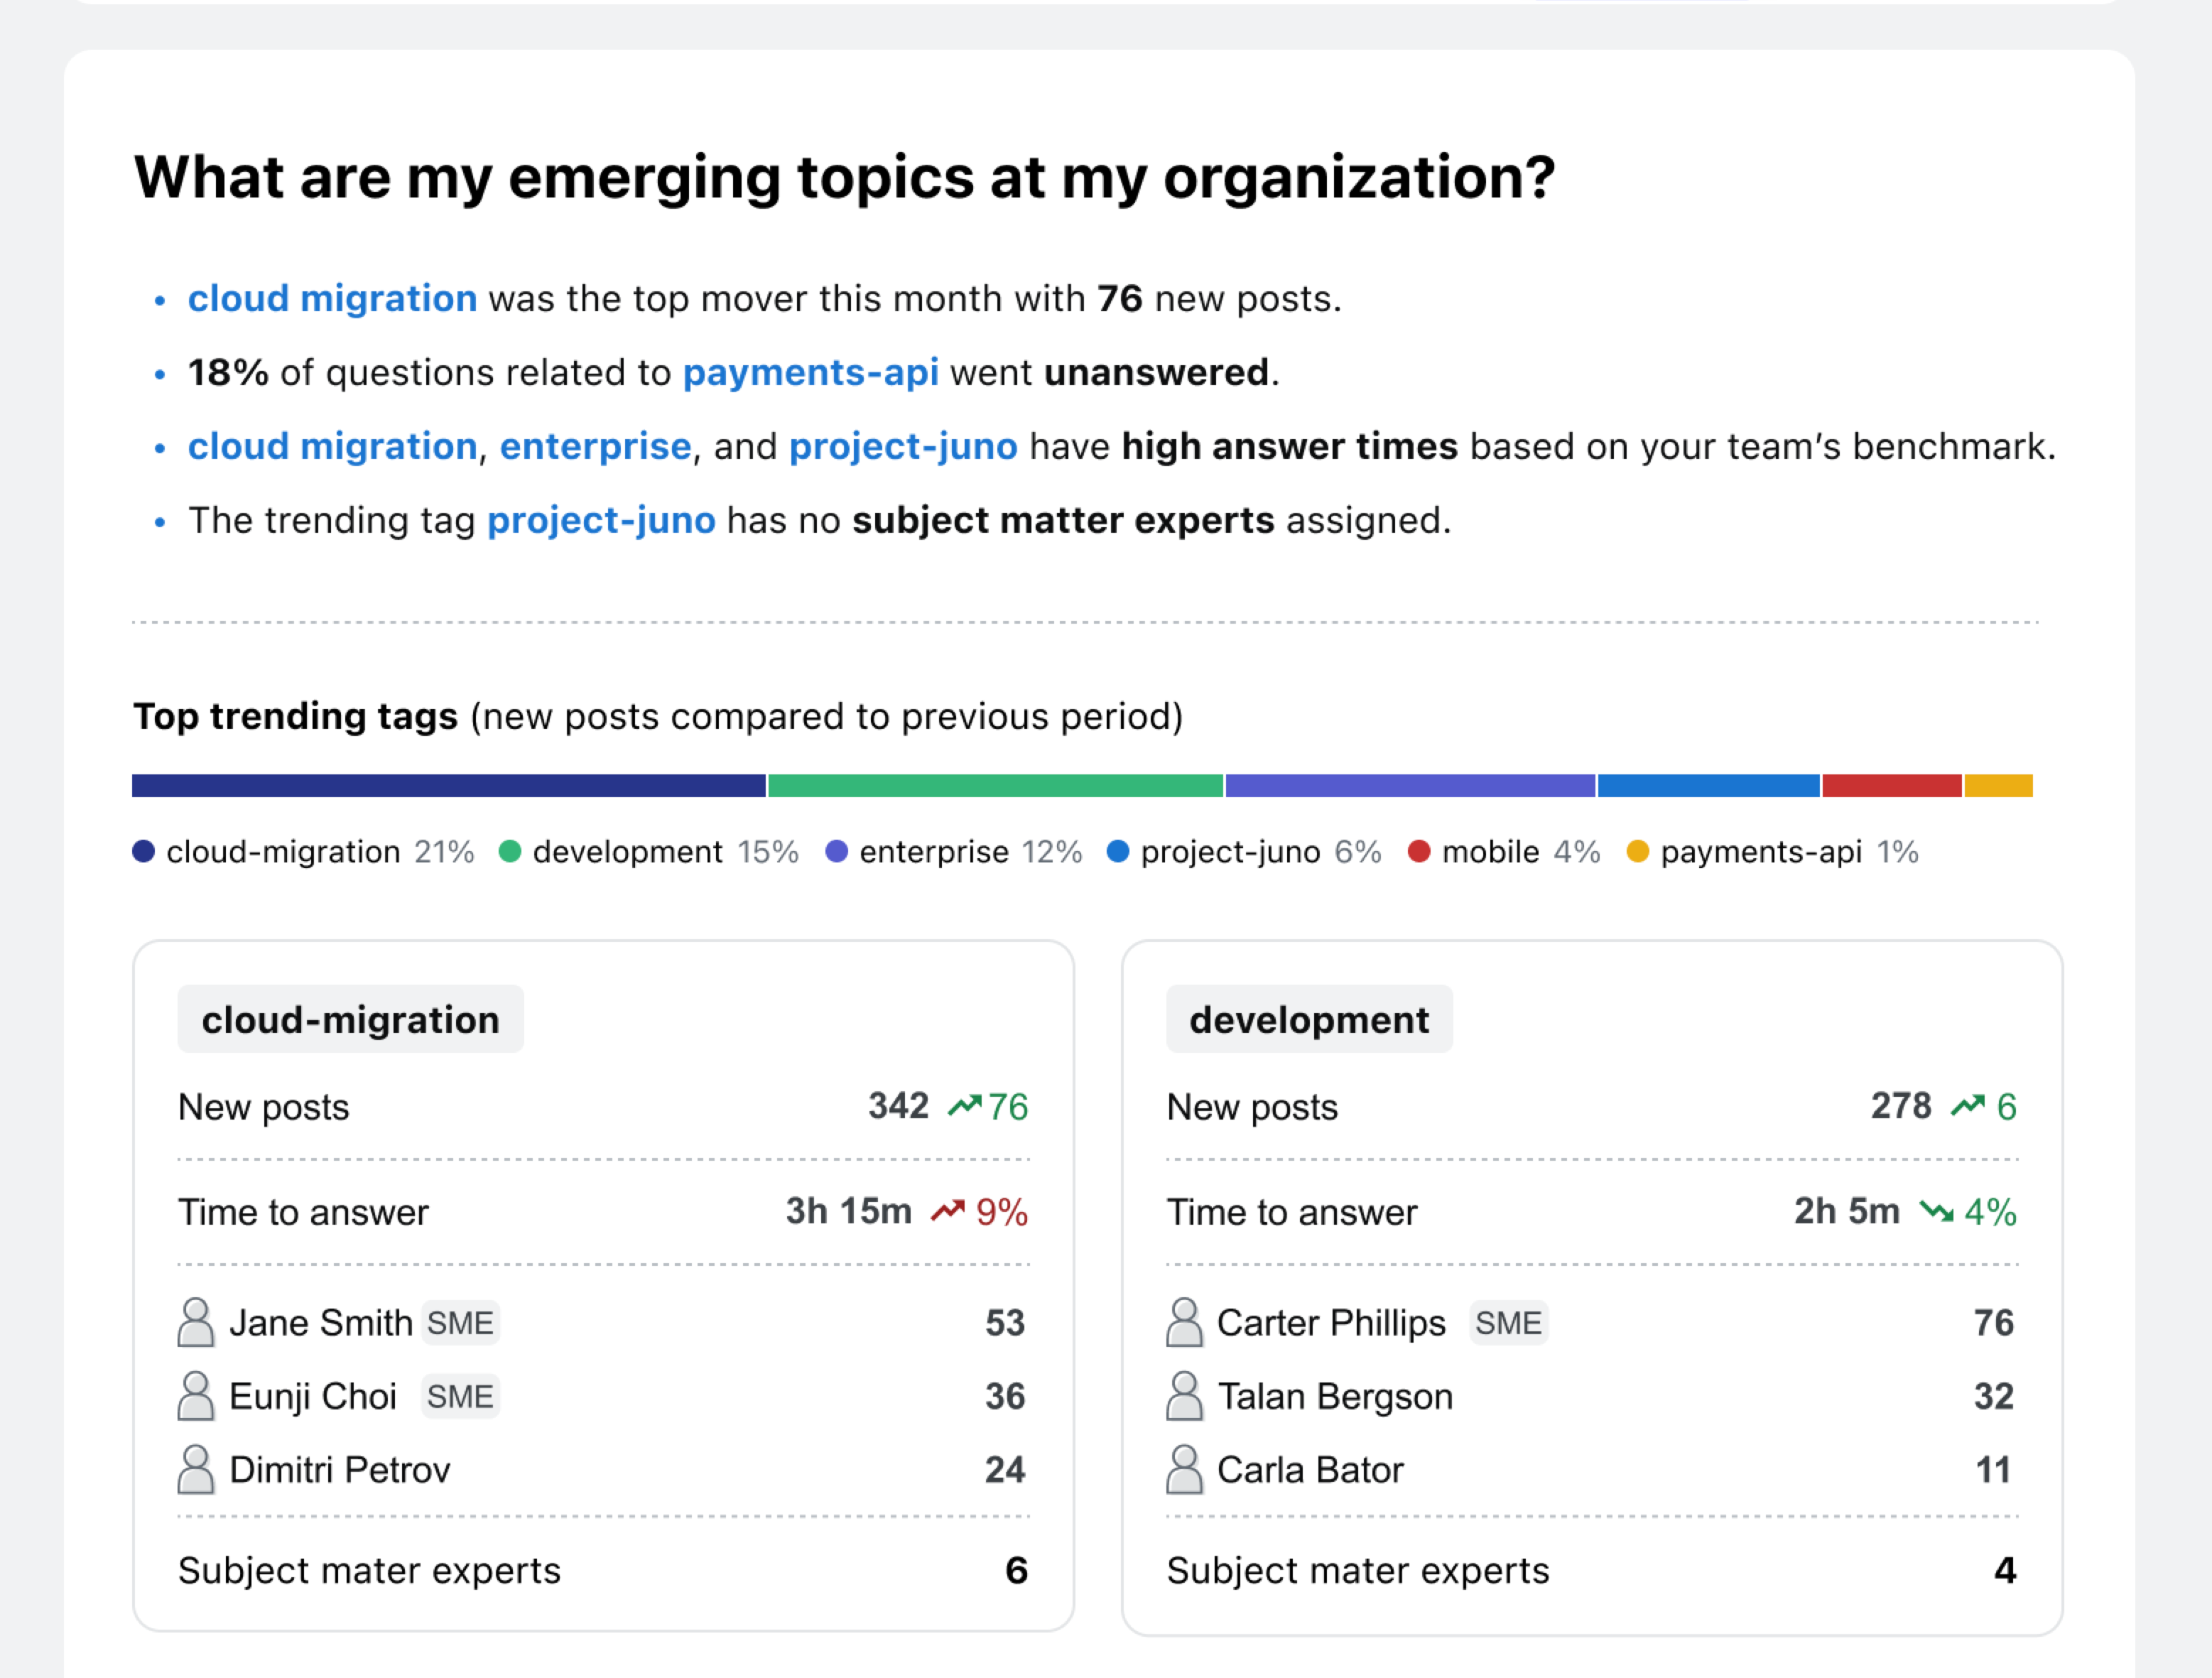
This section surfaces popular tags that are likely tied to key business initiatives, like cloud migrations and new product development. It also identifies gaps in subject matter expert (SME) coverage of these tags that can drive up your community's median time-to-answer and number of unanswered questions.
How people find answers
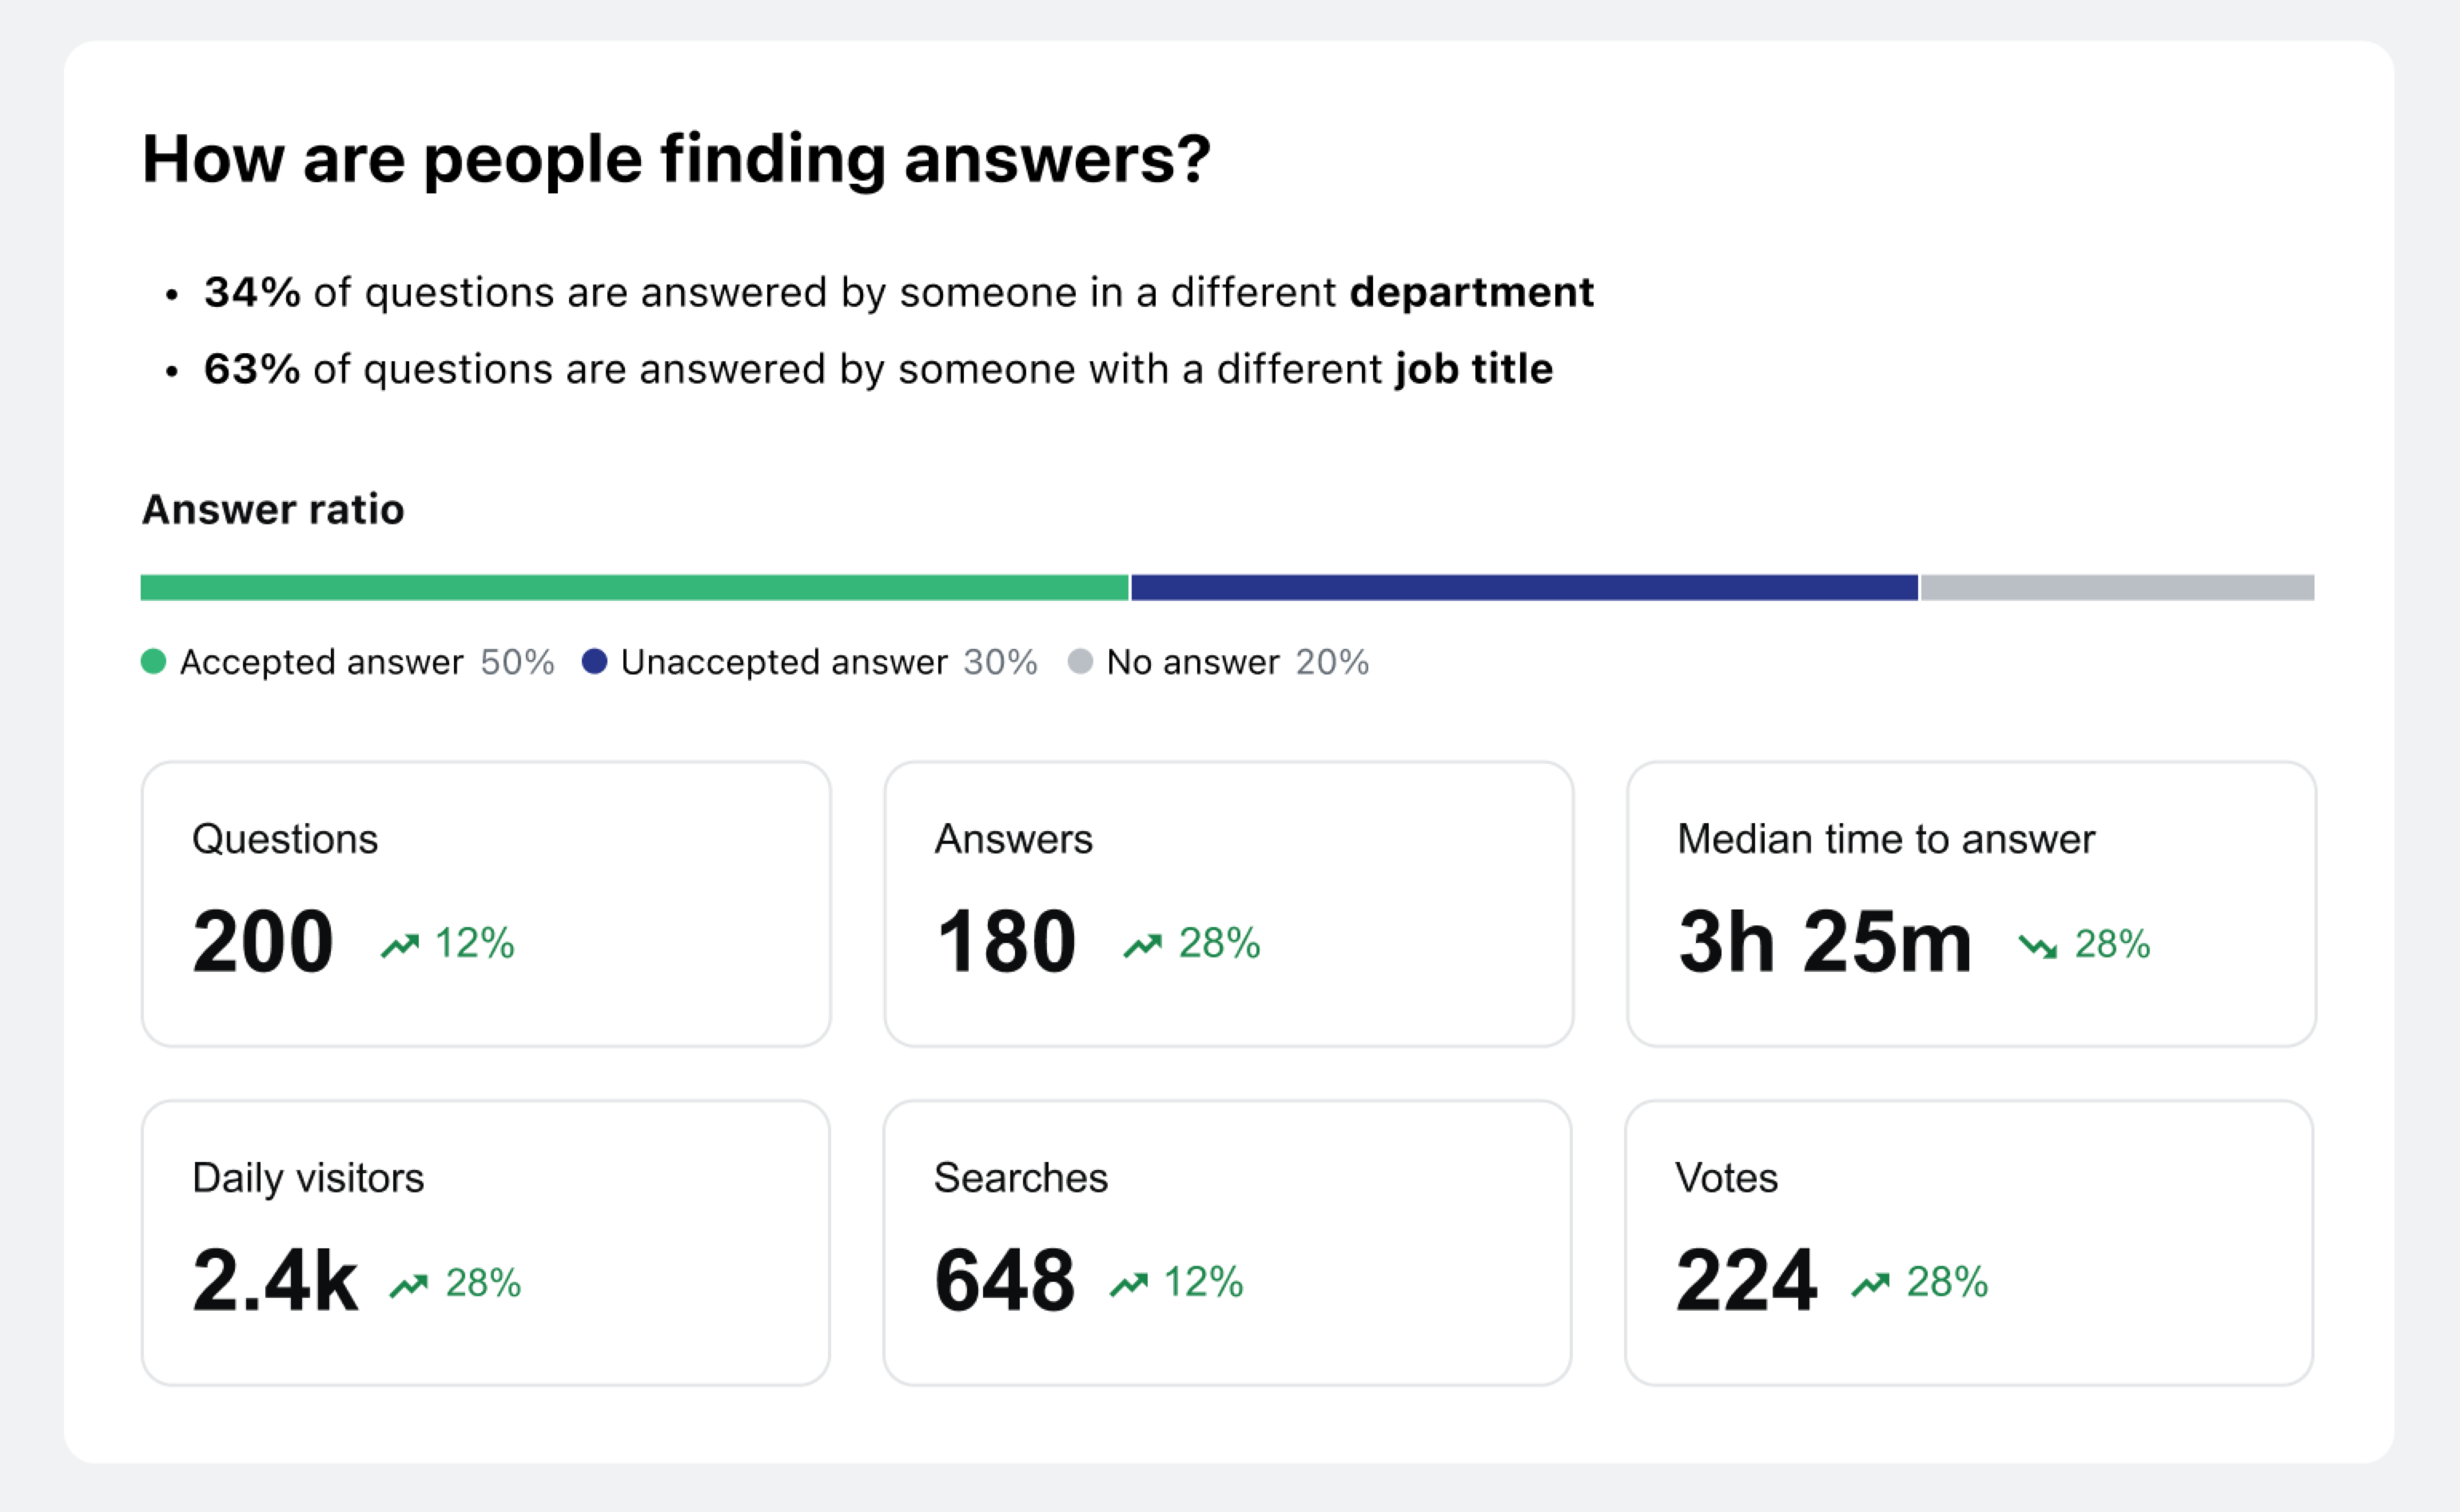
You might recognize these metrics from the Connectivity section of the Dashboard and the original Weekly Dashboard Report. Connectivity helps you track and act on cross-functional collaboration metrics, like how many questions are answered by someone in a different department or with a different job title. The other metrics demonstrate how your community is sharing and interacting with knowledge and how activity is trending since the last reporting period.
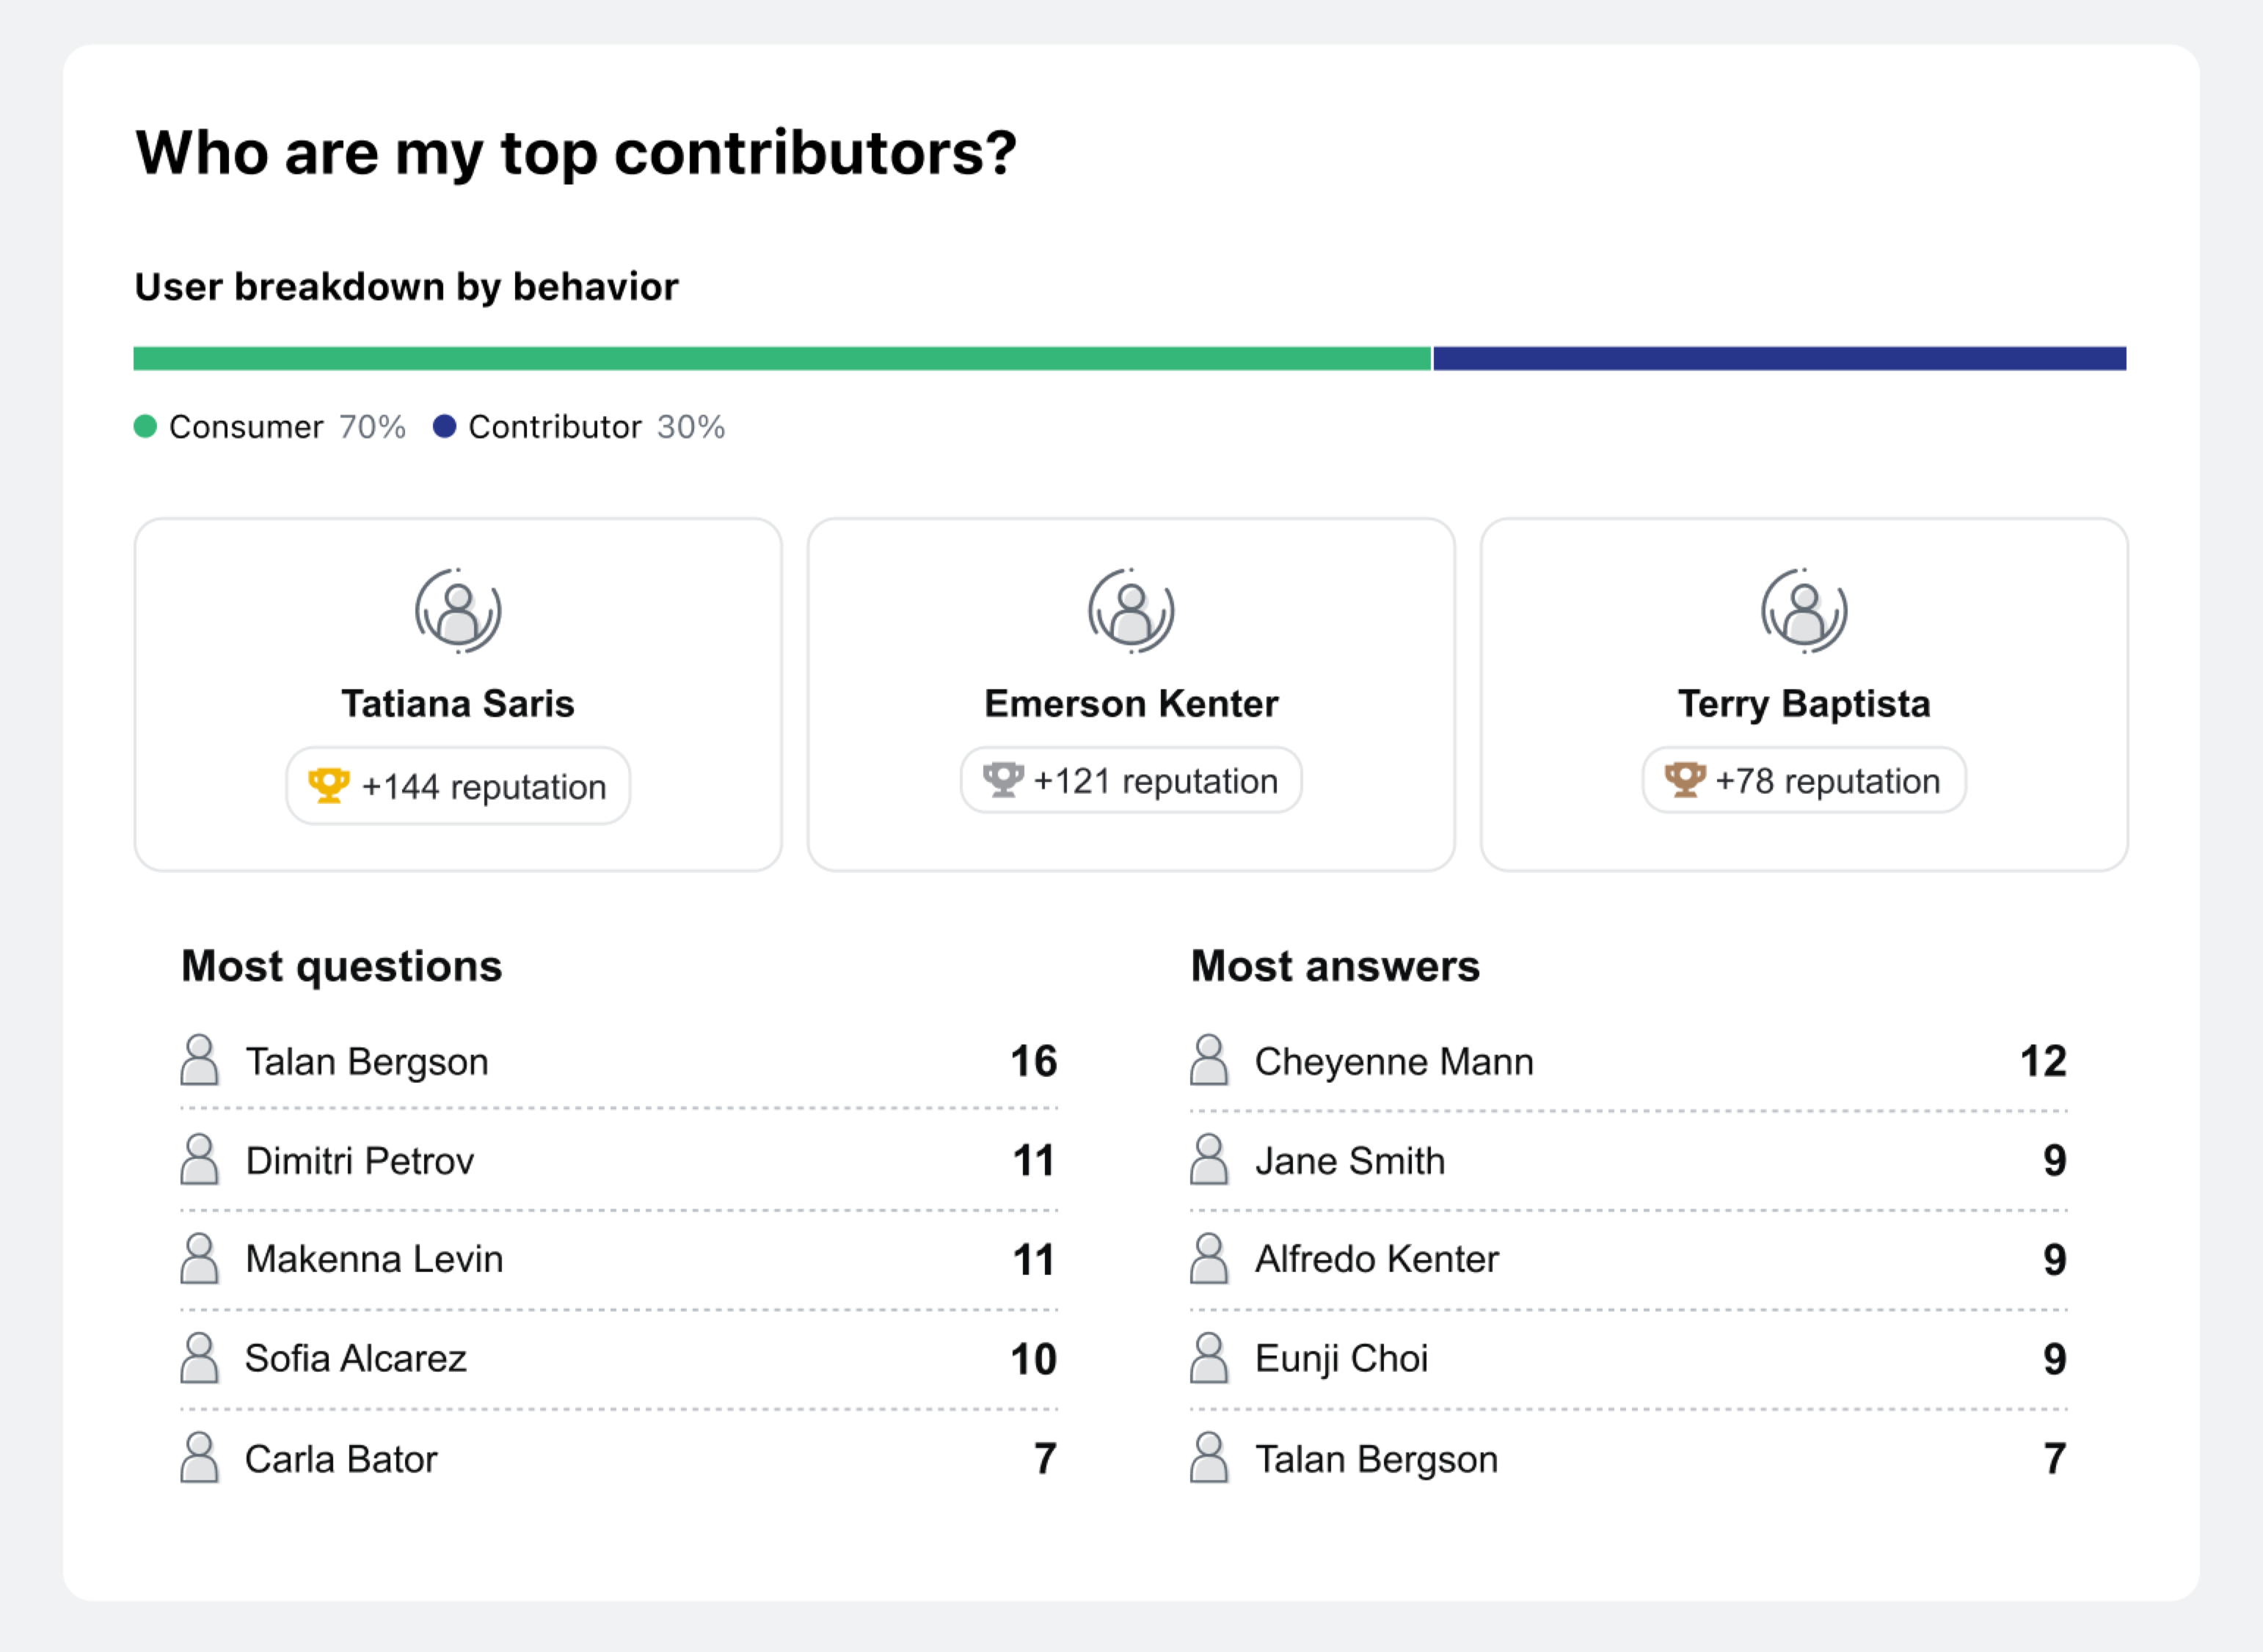
Top contributors
This last section is all about recognizing and celebrating top contributors in the organization so executive stakeholders have visibility into who’s sharing their knowledge and expertise. It also provides ideas for who can fill SME gaps uncovered in the “Emerging topics” section.
Start sending the report today
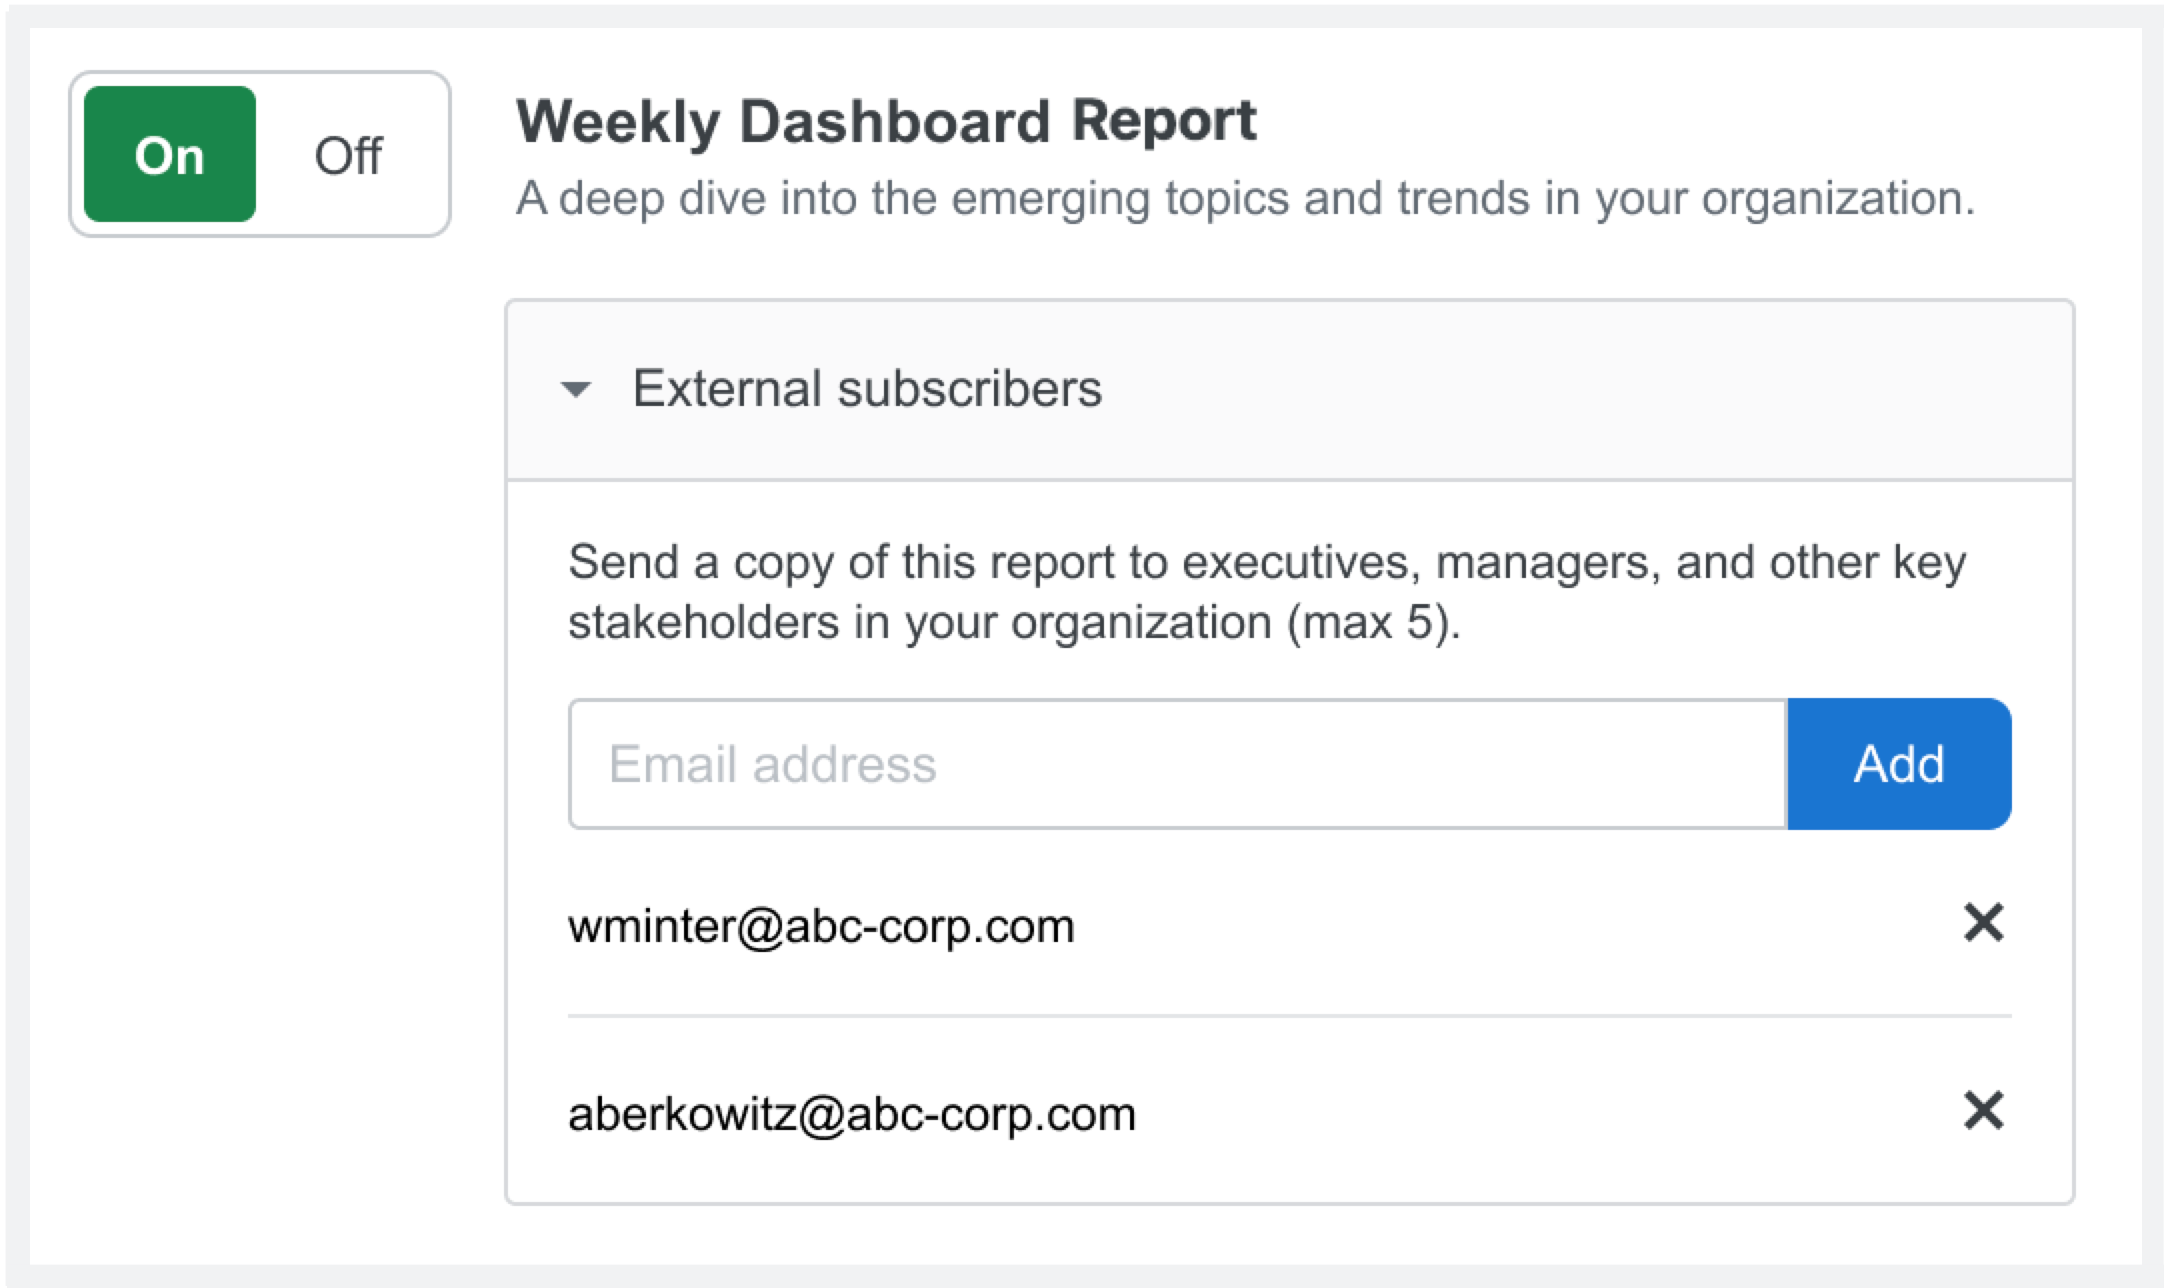
To start sending the report, site administrators should go to Admin settings > Email and notifications to add up to five email addresses. Email recipients do not have to be users but do need to be from the same company and have a company email address. The report sends each Monday and includes data up until the previous Friday.